
The 【Event Data】 function aims to provide customers with a highly customizable data monitoring solution.
Customers can use their own programs to generate numerical event data and transfer the data to the Watchdog host using FTP or NFS protocols. This function can analyze the data after receiving it based on the set upper and lower limits, timeout conditions, etc., and issue alerts when necessary.
This feature is suitable for scenarios where specific application data needs to be integrated into the Watchdog system, such as periodically monitoring Load Balance connection statistics to evaluate distribution efficiency, etc.
When system data is abnormal, it is difficult for the person in charge to know and control the problem immediately, which affects the ability to handle it promptly, making it impossible to:
➢ Release information through a unified channel
➢ Compare whether the data is abnormal
➢ Perform long-term and short-term data analysis
➢ Analyze the occurrence time of the event or the situation of resolution
➢ Monitor in real-time
➢ Link command control
➢ Integrate the operations management system to achieve a standard control mechanism
Steps to use 【Event Data】:
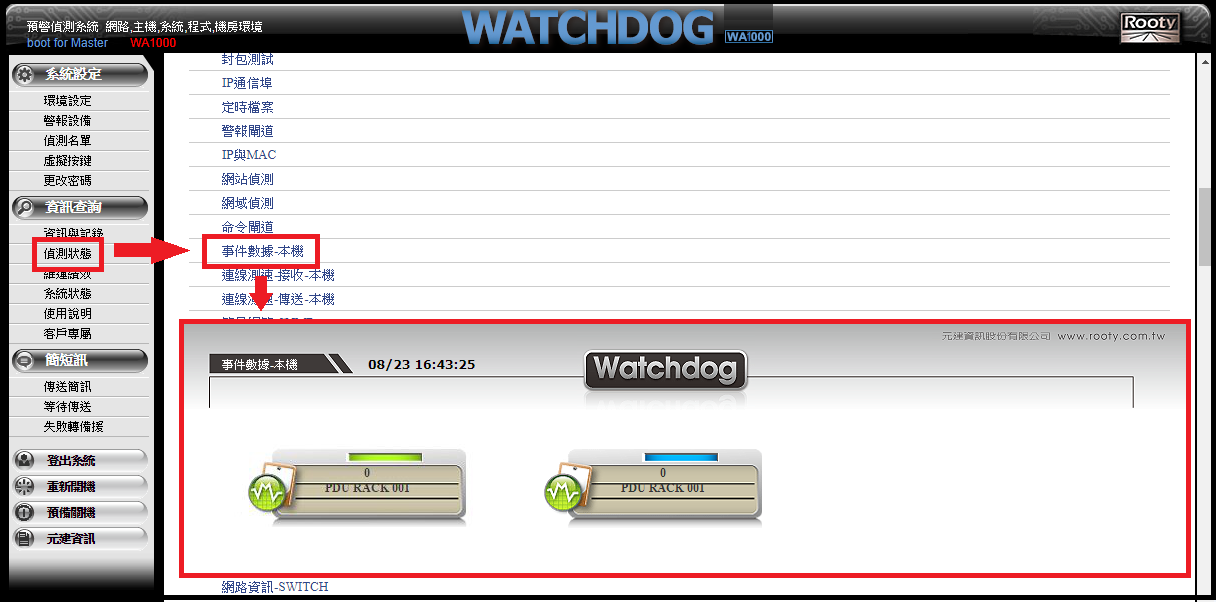
1. In the 【Event Data - Local】 field on the Watchdog host, first set an 【Event Name】, such as: 【test】.
2. Set relevant parameters, such as upper and lower limits of alerts, upper and lower limits of data, data units, timeout time, etc.
3. Use dedicated tools or programs to collect the required data and generate a file with the same name as the 【Event Name】 (e.g., 【test】). The file content should contain only one value (e.g., 【50】).
4. Automatically upload the file to the specified path on the Watchdog host through a dedicated customer program.
5. The Watchdog system will automatically read the file and analyze it based on the set parameters to determine whether an alert needs to be issued and perform subsequent data analysis.