In the monitoring items of network devices, the devices that can be set include
Switch, Firewall, Router, and Load Balance.
WATCHDOG system collects data from various devices through SNMP, performs analysis, and management.
Before monitoring, please ensure that these devices have enabled SNMP.
WATCHDOG system also supports devices that use SNMP v3.
Among various network devices, Switch is currently the most commonly monitored device.
WATCHDOG system extracts specific (MIB) or (OID) from these devices.
Through this information, using Switch as an example,
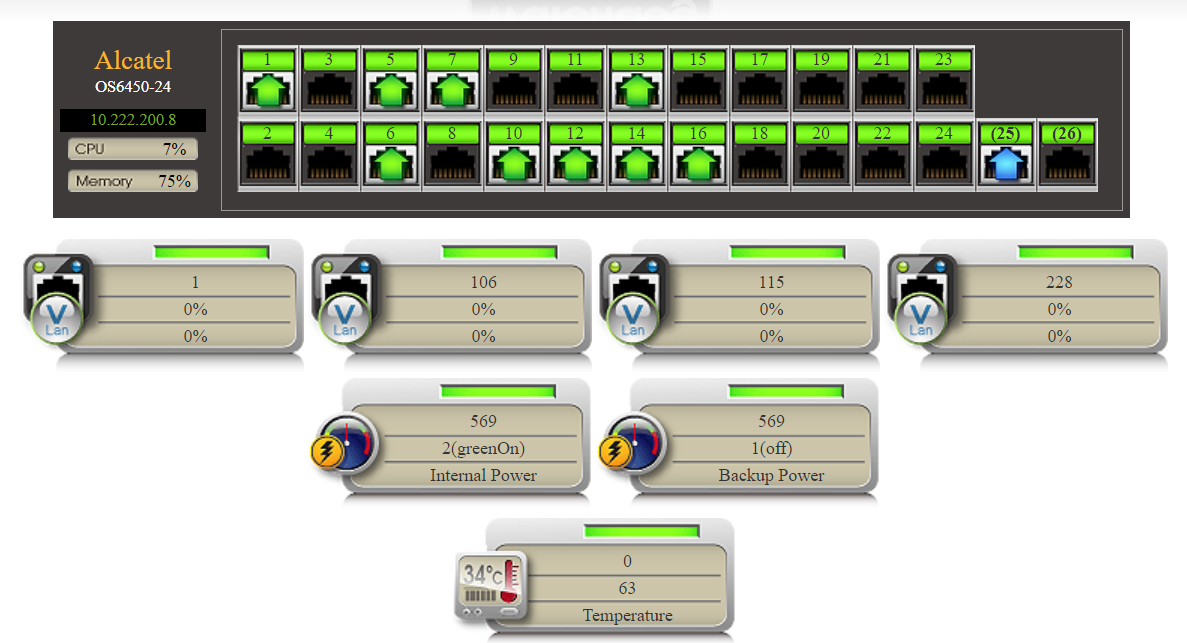
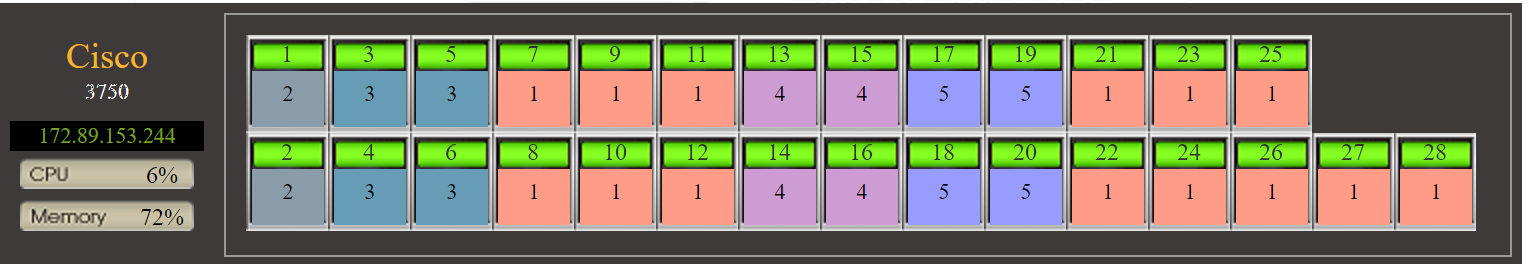
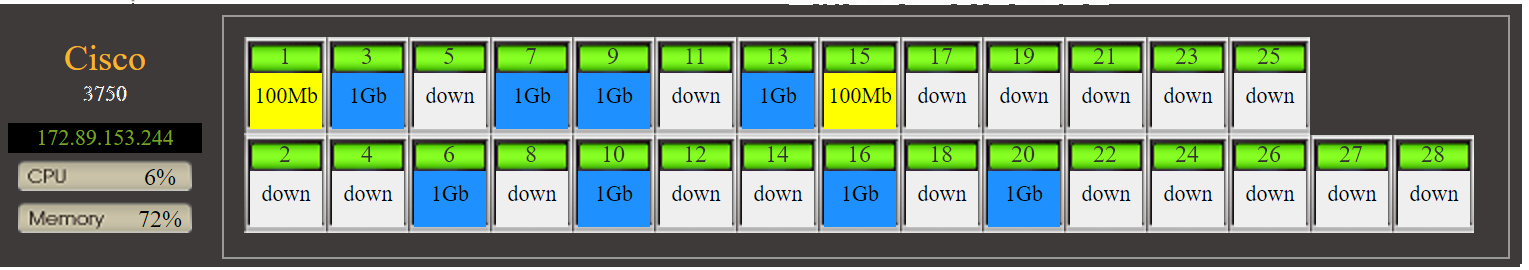
WATCHDOG system can monitor the overall information of the Switch, the network traffic and status of each port,
as well as the operation status of the device's fans, internal temperature, power status, etc.
Monitoring Screen Introduction -
Taking Switch as an Example
In the "Network Devices" monitoring section, it includes most devices that obtain information through SNMP,
and here, using Switch, which is most needed in practical monitoring, as an example introduction.
The following is a list of the monitoring functions of the WATCHDOG system for network devices:
Host Hardware Layer
➣CPU Usage
➣Memory Usage
➣Power Supply, Temperature Sensors, Fan Status
Serial Architecture - Connecting Other Devices Through Switch Interface
➣Connection Topology Map: Display the association between each port (PORT) and MAC, IP, device information (such as: server).
➣Information Device Location Map
➣Traffic Analysis and Records: Including traffic ratio/sec, Bytes, packet (Packet) statistics, port speed, MTU, and analysis, statistics, and information according to the entire SWITCH, VLAN, and each port (PORT).
For example: packet traffic ratio - in and out,
Packet traffic count - in and out,
Broadcast packet traffic - in and out,
Error packet traffic - in and out,
Ignored packet traffic - in and out,
Unknown packet traffic - in and out,
Status Information - Viewing Switches with Major Items Separately
➣VLAN Distribution Map
Through the unique technology of the WATCHDOG team, the VLAN architecture diagram is presented in a graphical manner with color blocks, showing the distribution of each Port VLAN.
➣Port Speed Distribution Map
Show the current transmission rate of each Port on the Switch, through graphical display, can intuitively reflect the traffic load status of various parts of the network.
➣Various Packet Traffic Ranking Maps
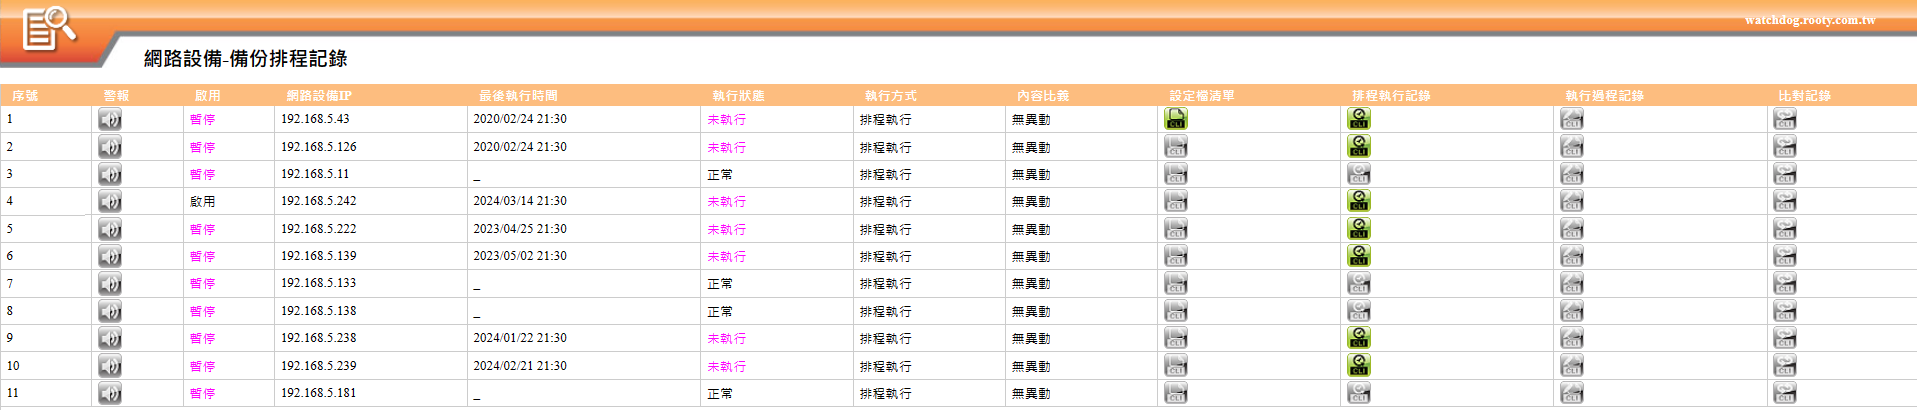
Switch - Automatic Backup Configuration Files (Config Files)
Support automatic backup of Switch configuration files (config). You can set the backup operation to be performed regularly every day on the WATCHDOG system.
In addition, the system supports flexible settings to retain a specific number (such as 10 or more) of Config file versions.
Advanced functions include automatic comparison of Config files to verify the differences between the current Config file and the last backup, thereby alerting to any unauthorized changes.
In addition, through the WATCHDOG's web operation interface, users can one-click package and download the Config backup files of hundreds of switches and save them as needed.
War Room Display - Various Switch Statuses
In a complex IT environment, this solution is committed to achieving comprehensive monitoring and display of the status of network devices such as Switches.
Through a centralized monitoring interface, not only supports detailed status monitoring of a single Switch,
including VLAN configuration, Port rate, and Port status, but also can classify and display all Switches based on these key indicators.
Users can use large-screen TV walls to centrally display the operating status of the overall Switch according to VLAN, Port rate, and Port status categories,
allowing management personnel to grasp the network health status in real-time and quickly locate and handle any potential problems.
Through a highly visual interface, it provides solid monitoring support for
the stable operation of the IT environment.
Advanced Functions
➣Search Switch Port by IP: You can enter the IP to directly search for the address and port of the Switch.
➣Track the connection port of the source IP and destination IP: Enter the source IP and destination IP to display the relationship diagram of the address and port of the Switch that the two IPs go through.
➣Custom Port Speed: Custom port carrying speed to calculate accurate traffic ratio for leasing dedicated lines (such as GSN).
➣WEB CLI (Command Line Interface): Obtain Switch configuration and status information at any time through the preset CLI commands.
Alert Items - Conditional Settings
Alert mechanisms based on the entire SWITCH, VLAN, and each port (PORT), including Switch hardware layer, various traffic numbers, port enable/disable (down/up), port speed, MAC control, offline alerts, etc.